The brief
Wales’ largest building society publishes a quarterly House Price Index. It wanted an interactive way to explore it: prices, deposits and repayments across all 22 local authorities. The design was supplied by Principality’s own team; our job was to build it and keep it running.
What we built
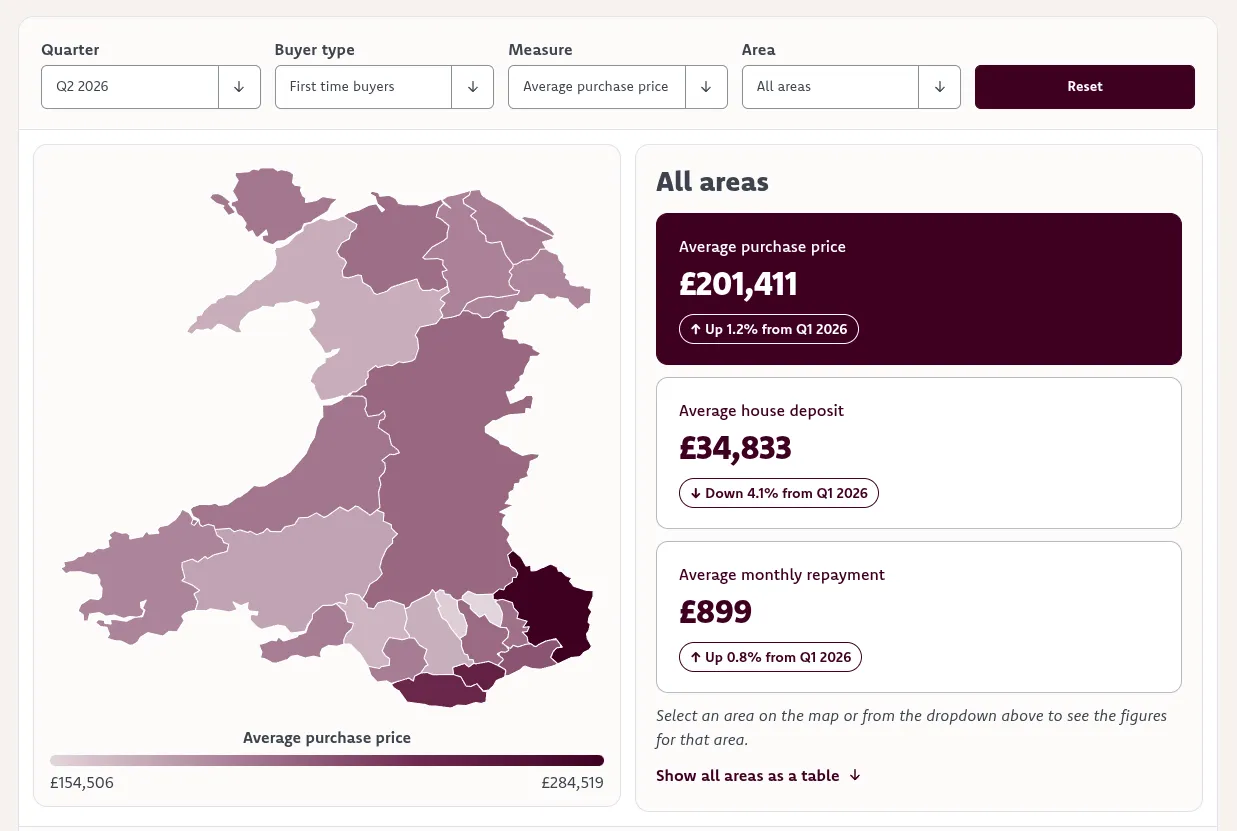
A fast, accessible interactive map with filters for quarter, buyer type, measure and area, a colour scale that updates as you explore, live summary cards with quarter-on-quarter change, and a table view for screen readers and anyone who prefers rows to maps.
Ongoing
Each quarter we process the latest mortgage data and publish it to the map, so the figures are always current and every past quarter stays available to compare.